Prepared for the Microsoft Professional Program in Data Science and roughly transferred into Markdown
EXECUTIVE SUMMARY
This report summarizes the statistical modeling and predictive analysis performed upon data originating from the United States Department of Education. The analysis aimed to predict the rate at which students would repay federal student loans. Such analysis informs the Department regarding which schools are better investments. The analysis also highlights schools to target for performance improvement.
Analysis included correlation and regression analysis on key variables in the data set to develop a model for predicting school repayment rate with the highest precision. Analysis initially separated the large data of 444 features to explore some likely candidates for inclusion in a regression model. After identifying several strong correlations, features were narrowed down by considering their relative importance to variation in repayment rate.
Analysis concludes that a mix of six features consistently predict repayment rates with Root Mean Squared Error of 9.99. The list below represents the key features as identified by the analysis.
-
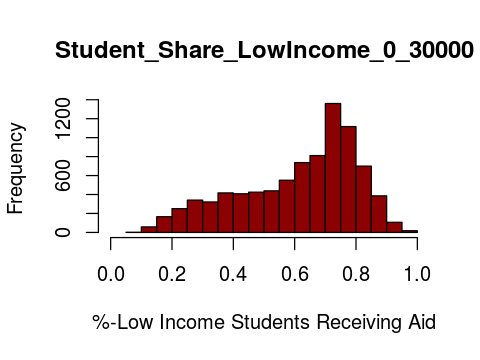
Student_share_lowincome_0_30000: Percentage of aided students whose family income is between $0-$30,000. A strong negative correlation indicates that the more low income students with financial aid a school has, the less likely those students will be able to repay.
-
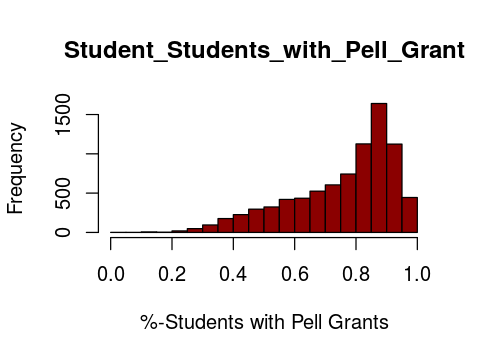
Student_students_with_pell_grant: Share of students who received a Pell Grant while in school. A strong negative correlation indicates the more students with Pell grants a school has, the lower its repayment rate.
-
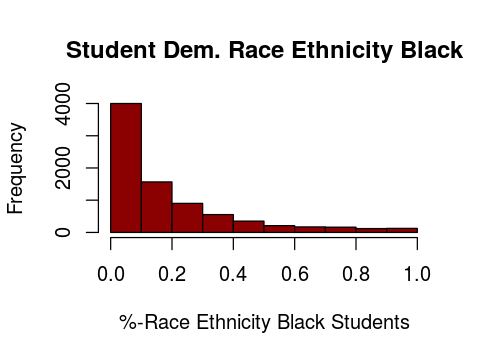
Student_demographics_race_ethnicity_black: Total share of enrollment of undergraduate degree-seeking students who are black. Analysis determined proportion of students who identify as black affects the ability to predict repayment rate.
-
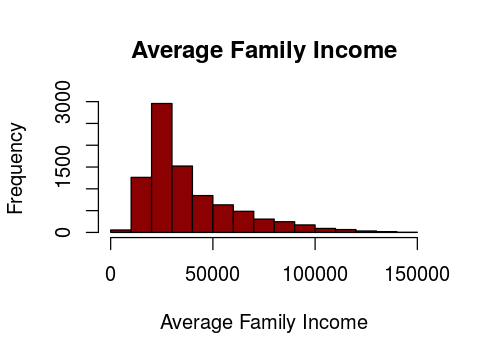
Student_demographics_avg_family_income: Average family income in real 2015 dollars. A weak positive correlation indicates that schools serving students from higher income families tend to have higher repayment rates.
-
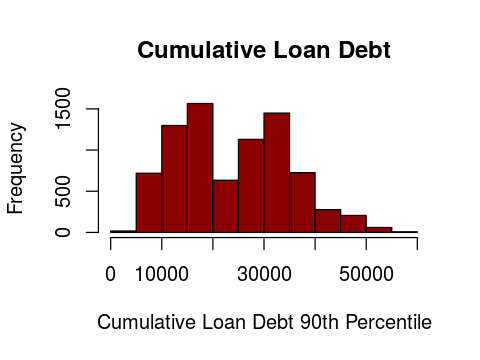
Aid_cumulative_debt_90th_percentile: Cumulative loan debt at the 90th percentile. Analysis determined proportion of students with loan debt in the 90th percentile affects the ability to predict repayment rate.
-
school_ownership: Control of institution (Possible Values: Private nonprofit, Private for-profit, Public). Analysis determined students at private, nonprofit school repay their loans more than students at public schools. Students at private, for profit schools have the lowest repayment rates.
Based on these data elements, a student’s family income seems to be the most likely predictor of repayment rate. Of the six, demographics_avg_family_income and share_lowincome_0_30000 have the highest correlation with repayment rate, with linear correlation coefficients of 0.823 and -0.840 respectively. The analyst concludes that schools predominantly serving students from low-income families represent the most lending risk.
INITIAL DATA EXPLORATION
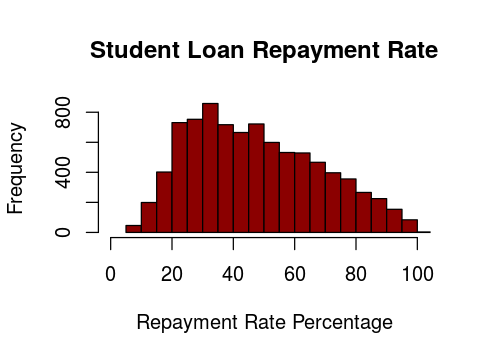
The analysis utilized 8,705 observations of universities and colleges in the United States from two fiscal years. Each observation included variables in a variety of categories, specifically academics, aid received, completion data, cost, student data, and school characteristics. Analysis sought to predict repayment rate, thus we began by generating basic information about repayment rates. A summary of repayment rate is shown below. The analysis relied on Microsoft Azure Machine Learning Studio (Azure ML) to explore and analyze data.
Roughly less than half of all students repay their loans such that their loan balance decreases. The closeness of mean and median values indicates the data is relatively normally distributed. The histogram of repayment rate frequency skews mildly to the right, illustrating the frequency of lower repayment rates. The min, max, and standard deviation indicate how wildly repayment rates can vary between schools which reinforces the importance of this study. A five percent repayment rate, the minimum rate found in the data, seems shockingly low for any school of higher education. Contrastingly, the data indicate the real potential of a 100% repayment rate.
| Min. | 1st Qu. | Median | Mean | 3rd Qu. | Max. | Std. Dev |
|---|---|---|---|---|---|---|
| 5.163 | 30.230 | 44.860 | 47.370 | 62.620 | 100.500 | 20.988 |
Individual Feature Statistics
Descriptive statistics for additional features are beyond the scope of this summary, considering over 400 features were provided for analysis. Summary statistics (minimum, maximum, median, mean, and standard deviation) were calculated for numeric features. A box plot was generated for the categorical feature school__ownership.
| Feature | Minimum | Maximum | Median | Mean | Std. Dev. |
|---|---|---|---|---|---|
| aid__cumulative_debt_90th_percentile | $3,500.00 | $57,500.00 | $27,371.09 | $27,810.39 | $9,500.00 |
| student__demographics_avg_family_income | $4,450.55 | $152,099.75 | $47,582.84 | $59,936.46 | $39,972.49 |
| student__demographics_race_ethnicity_black | 0% | 100% | 29% | 37% | 30% |
| student__students_with_pell_grant | 5% | 100% | 68% | 62% | 26% |
| student__share_independent_lowincome_0_30000 | 28% | 98% | 74% | 69% | 18% |
Figure 1 - Summary Statistics for Final Model Features
The histograms below illustrate the distribution of data for the selected features. The first shows that the percentage of low income students who received aid has a left-skewed frequency which, as expected, indicates that lower income students tend to get financial aid. Proportion of students with Pell grants is also left skewed with a broad distribution across low Pell grant usage. Lastly, the histogram of family income shows that a large proportion of families reported an income of less than $50,000.
Cumulative loan debt (90th percentile) proved to be an unlikely predictor. Its distribution strays from any hint of normality, yet removal of this features degraded the performance of the model. Similarly, when other ‘race_ethnicity’ features were tested the model performance worsened. Only ‘race_ethnicity_black’ moved the needle and added value to the predictive model. The data skews to the right, expectedly, indicating that for most schools less than 10% of the students identify as Black.
Regarding school ownership, median repayment rate hovered around 65% for private, nonprofit schools, giving it the highest repayment rate of all school types. Public school repayment rates just cleared 50%, making them more in line with the overall median repayment rate. Private for-profit schools deliver the lowest repayment rates. Considering these schools can have substantially higher tuitions than public schools, a 30% repayment rate is particularly problematic. Of note, the repayment rate range for each school type is quite broad indicating each school type has the potential to generate high repayment.
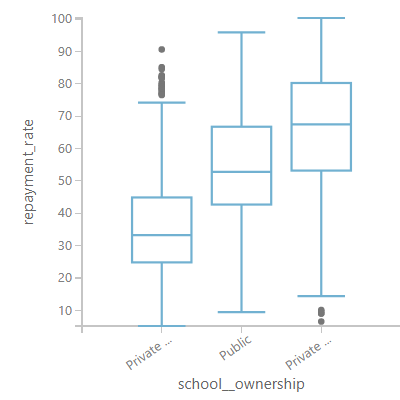
Figure 2 - Box Plot of Private-for-profit, Public and Private-nonprofit observation frequency
Correlation analysis calculated the correlation coefficients for the numeric columns; results are shown below.
| aid__cumulative_debt_90th_percentile | school__ownership | student__demographics_race_ethnicity_black | student__share_lowincome_0_30000 | student__students_with_pell_grant | repayment_rate |
|---|---|---|---|---|---|
| 0.006909 | -0.003708 | -0.012289 | -0.004478 | -0.010002 | 0.002536 |
| 1 | 0.383445 | -0.014306 | -0.428752 | -0.391435 | 0.187695 |
| 0.383445 | 1 | -0.342923 | -0.945677 | -0.879277 | 0.822928 |
| -0.014306 | -0.342923 | 1 | 0.381469 | 0.318952 | -0.48777 |
| -0.428752 | -0.945677 | 0.381469 | 1 | 0.86966 | -0.835665 |
| -0.391435 | -0.879277 | 0.318952 | 0.86966 | 1 | -0.778374 |
| 0.187695 | 0.822928 | -0.48777 | -0.835665 | -0.778374 | 1 |
These values represent the Pearson correlation coefficients for each pair of features. As calculated, analysis concludes strong linear relationships exist between school_ownership, student_demographic_race_ethnicity_black and student_share_low_income_0_30000. As mentioned in the initial summary, ethnicity and income both exhibit strong negative correlations with repayment rate.
Data Cleansing
For many features, a large portion of the values were missing. To begin the analysis, columns with more than one-third of their values missing were eliminated as candidate features. After applying this rule, 444 features decreased to 78 features.
Next, missing values for the remaining numeric features were replaced utilizing the mean value for the feature. Mean served to skew the data as needed, as opposed to the median which wouldn’t provide as much leverage for prediction. Finally, missing values for string variables were replaced with a generic label of “unknown.”
EXPLORATORY LINEAR REGRESSION ANALYSIS
Utilizing the feature permutation tool in Azure ML, features were systematically eliminated based on their importance to the model as reported by this tool. Analysis required several rounds with the tool, eventually narrowing down the group such that the removal of any one feature increased the Root Mean Squared Error. The final model ultimately consisted of these six features: student_share_lowincome_0_30000, students_with_pell_grant, student_demographics_race_ethnicity_black, demographics_avg_family_income, cumulative_debt_90th_percentile, and school_ownership.
Below, scatterplots illustrate the relationship between repayment rate and the selected features. Analysis concluded after determining that removing one of these features decreased the veracity of the model.
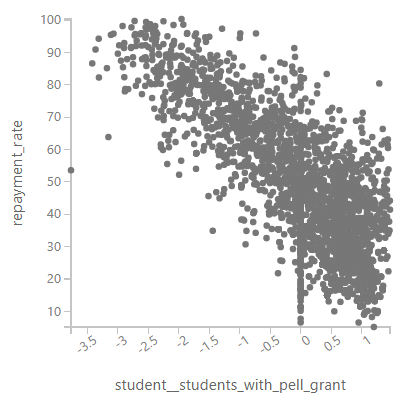
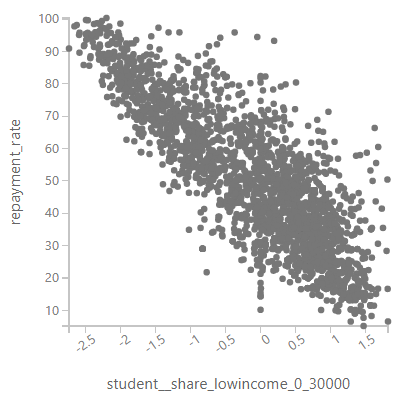
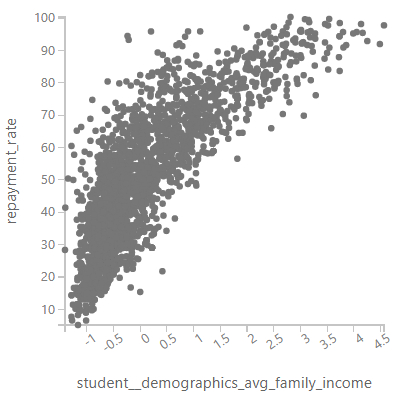
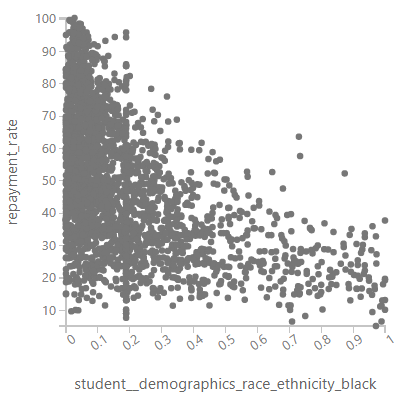
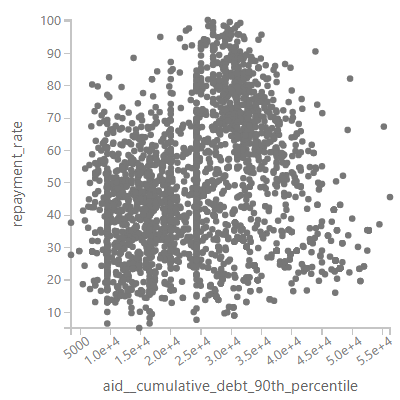
Figure 3 - Scatterplot diagrams of final model features
The model was trained with 70% of the data set and tested with the remaining 30% of the data. A scatterplot illustrating the success of scored (predicted) repayment rates compared to actual repayment rates is shown below.
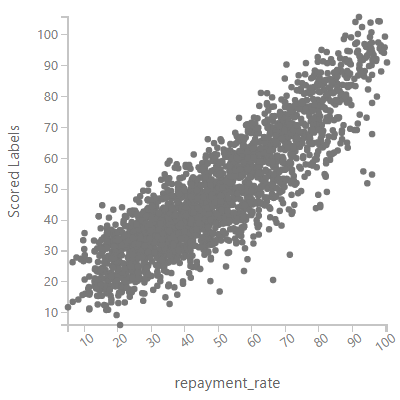
The plot shows a clear linear relationship between predicted and actual repayment rate values. The Root Mean Squared Error (RMSE) for the final training-test submission is 9.76. Analysis interprets RMSE in units of measurement from the vertical axis, thus an RMSE of 9.76 represents an average error of 9.76% from the actual repayment rate. The coefficient of determination came out to 0.78, indicating 78% of the variation in repayment rate could be explained by the model function. Analysis applied the resulting model to the competition test data set consisting of over 6,391 observations. A Root Mean Squared Error of 9.9942 was calculated with this model.
To try and improve the model, outliers were removed using an Azure ML module that allowed the top and bottom one percent of values to be replaced with values at the threshold. This garnered a small improvement of one tenth of a percent. Upping the threshold to five percent on each end provided a slightly better RMSE, 9.37, for the training-test data. The coefficient of determination remained unchanged. This new model was then applied to the competition test data set. The updated model generated a calculated RMSE of 10.0685 which failed to improve upon the previously submitted model where outliers remained in the data set.
FINDINGS
The analysis supports the possibility of accurately predicting the repayment activity from a school based on the school’s characteristics and its students’ characteristics. A student’s family income appears to be the biggest indicator of future ability to repay student loans.
Predictive analysis, however, does not reveal the cause of lower repayment ability. Is it because certain students are ill-prepared for the payments required? Do students at schools with low repayment rate experience career success after school? Are lower repayment rates related to loan deferments or forebearances? Future analysis on this topic should include a comparison of outcomes for students from schools with high and low repayment rate as well as reporting on reasons why students fail to repay loans.