The Challenge
The Reddit DataIsBeautiful group holds friendly, monthly data visualization competitions. Every month there the moderator presents new data sets and different challenges to be tackled by participants.
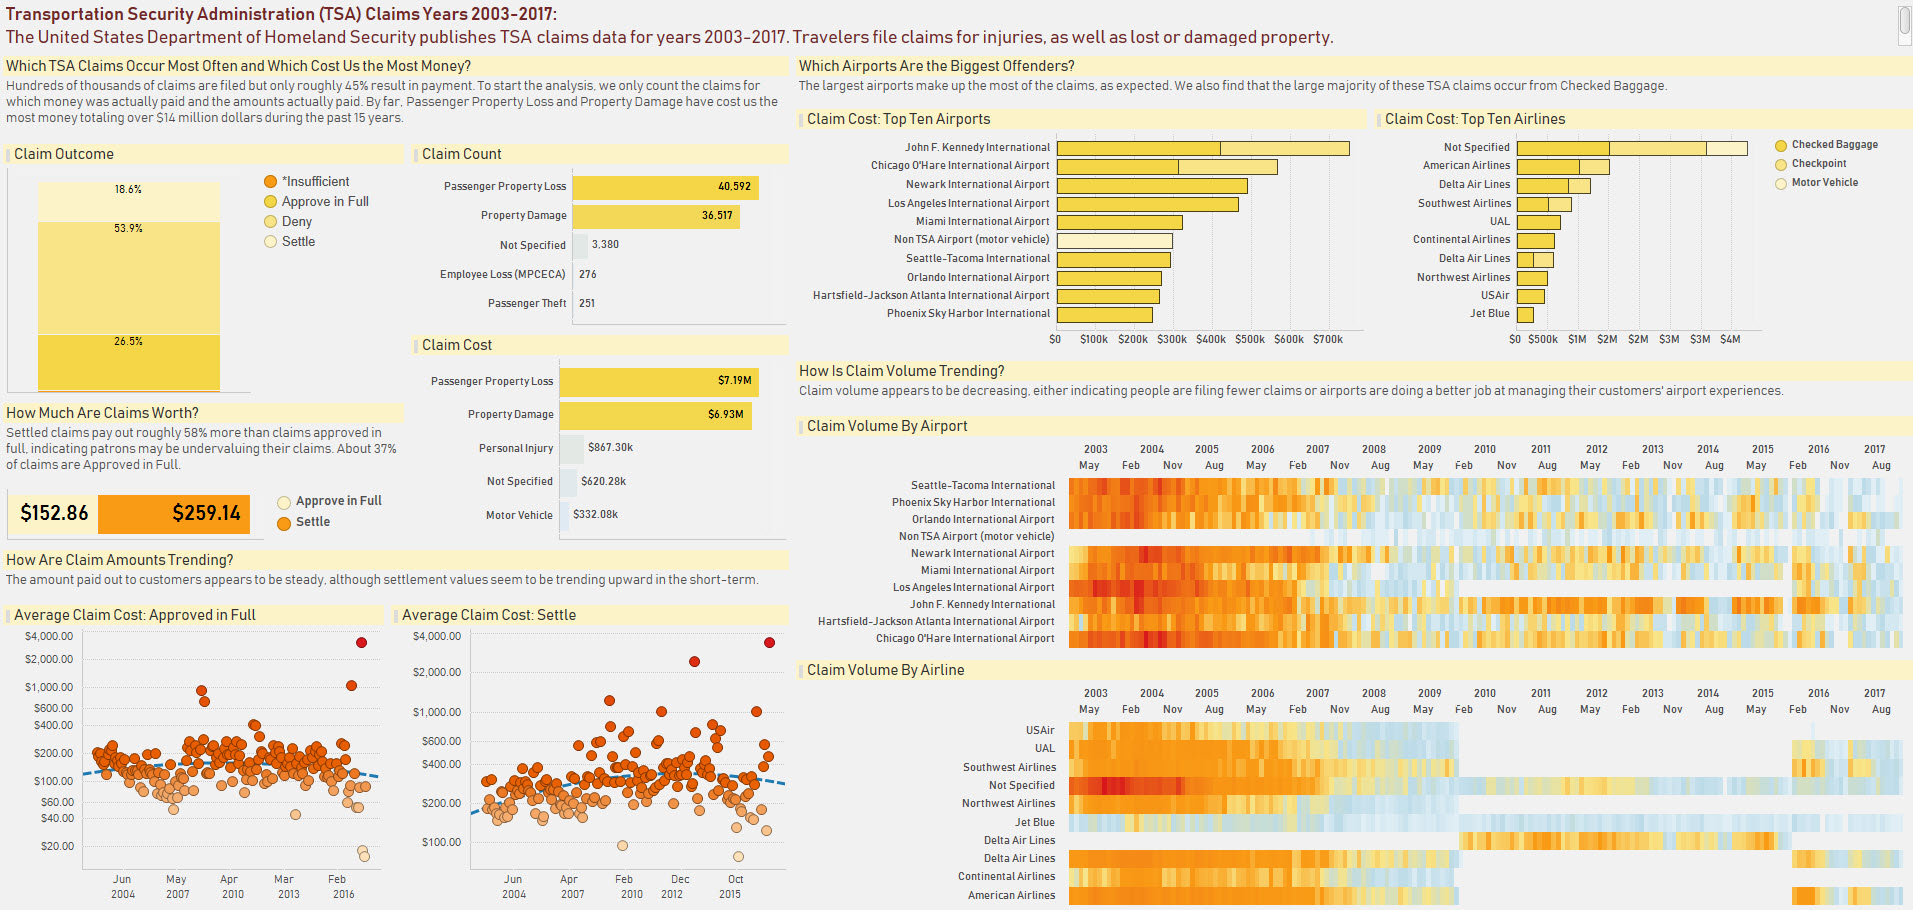
The August 2018 competition challenged participants to visualize United States (US) Transportation Security Administration (TSA) data.
The Data
I chose an exploratory analysis asking the questions that immediately came to my mind when looking through the data.
The TSA data sets are available on the US Department of Homeland Security website.
The first several years of data sets are in Excel friendly formats but the last two years of data (2016-2017) proved to be a challenge as they were provided in PDF format. After exploring options available through both R and Python, I chose the Tabula package to extract the data from the PDF into a table. I’ll continue to call it Tabula instead of Tabula-py because I used the term “tabula” in the code.
Tabula
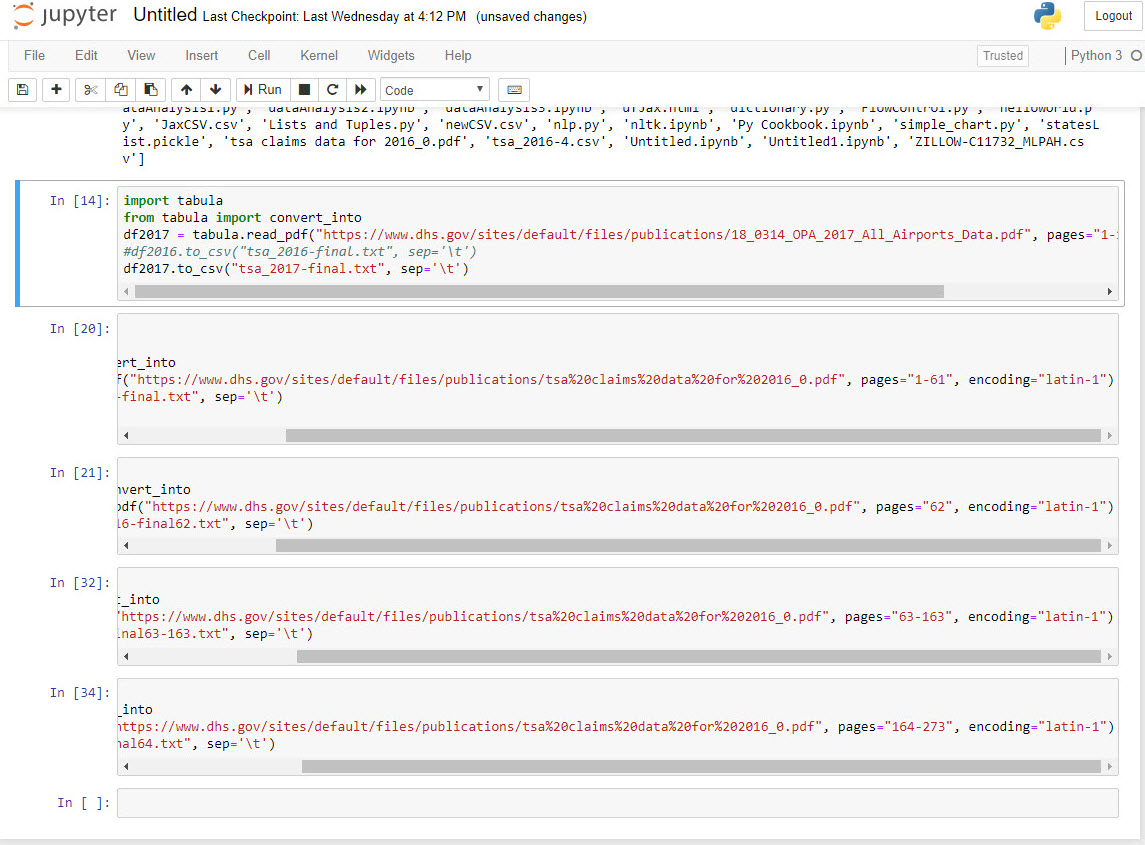
I used Tabula with my IDE of choice, PyCharm, and opened up a Jupyter notebook because at the time I felt it was easier to work with.
With the tabula package, I converted the pdf into a Python data frame, then converted the data frame into a csv file. I ran into a couple issues trying to do this.
- I had to add Java to the system environment variables on my PC. I did not realize this ahead of time and I frowned a few errors before I figured out the issue.
- I had to change the encoding of the file. If I had been more forward-thinking, I would have saved the error message I received but I did not. Essentially the issue was that there were some non-English characters in the file. I changed the encoding to “latin-1” and that resolved the issue. The Tabula ‘read_pdf’ function allows a parameter for encoding so I changed this easily.
-
The Tabula pdf reader did not find the same number of columns on every page. Unsure of how to resolve this, I did some simple boundary testing and determined on which pages the program became misaligned. I tried created separate files for the mismatched pages and it worked. I ended up with four csv files to load into Tibco Spotfire with the previous years data.
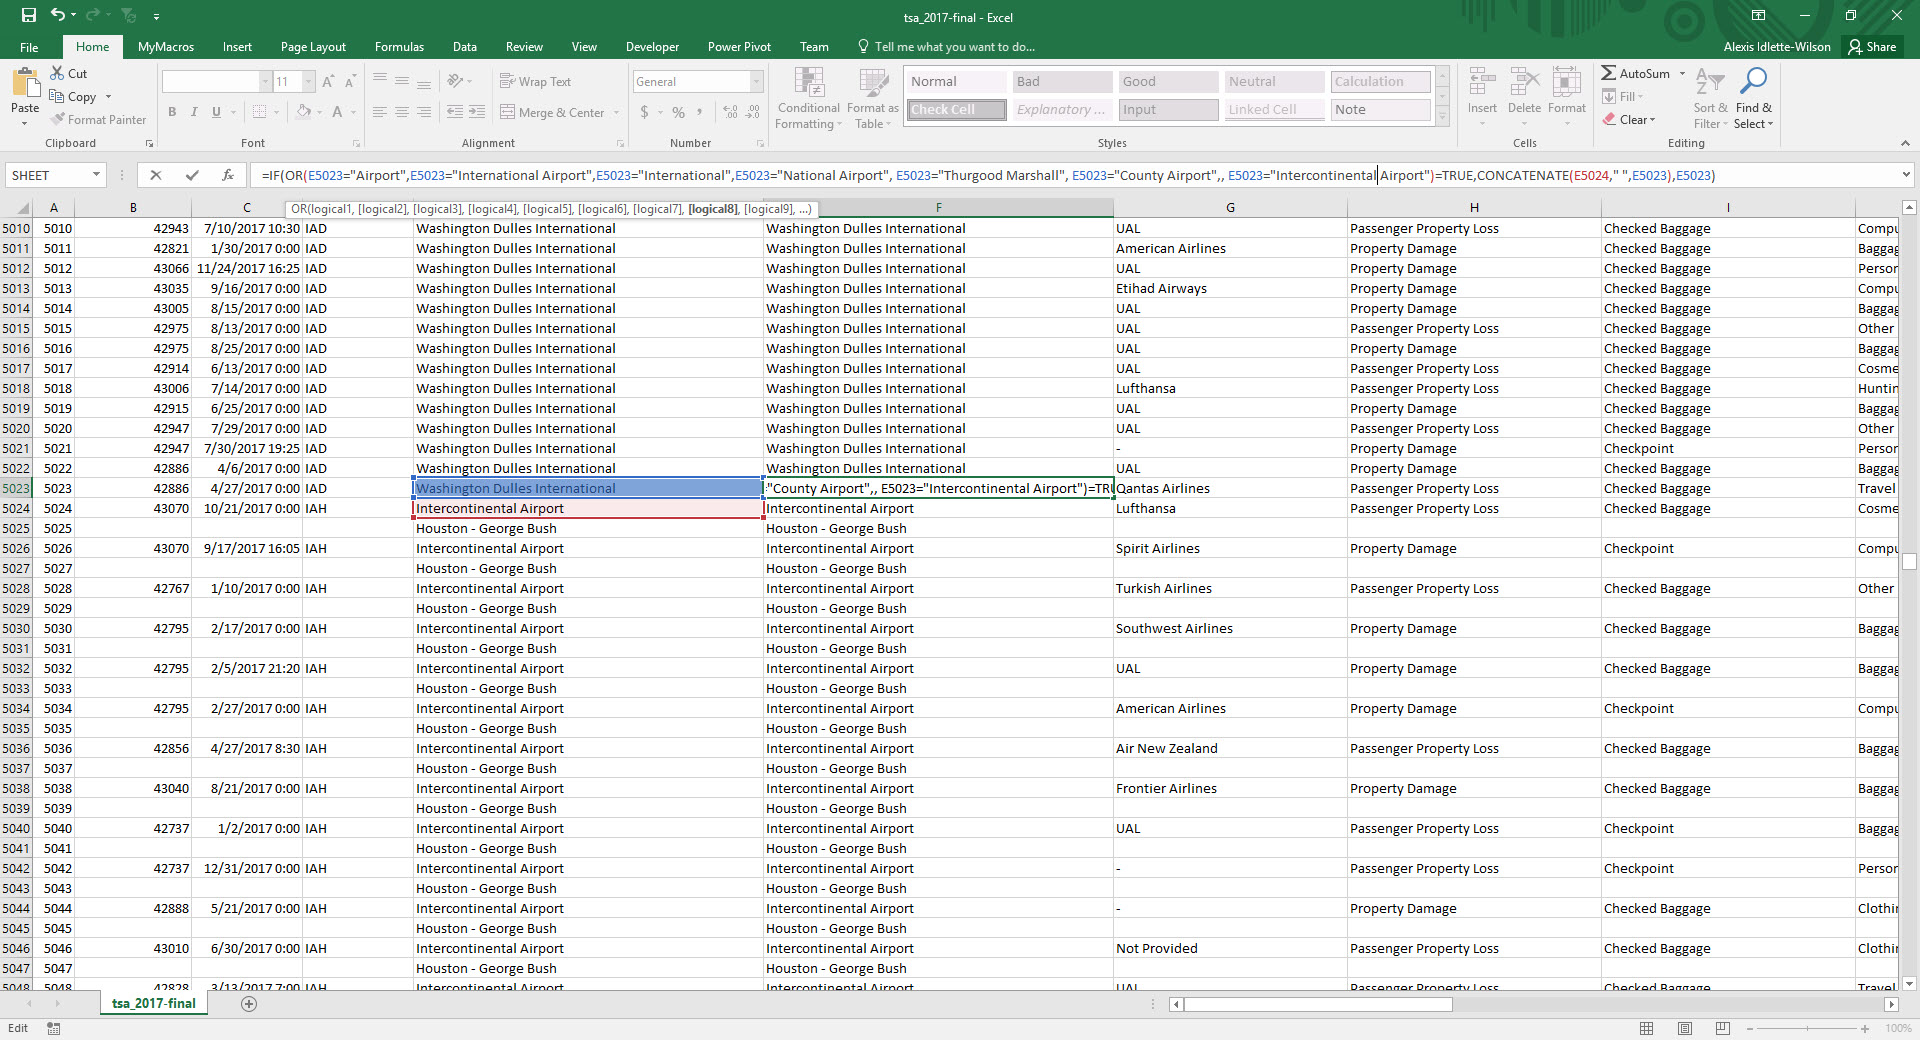
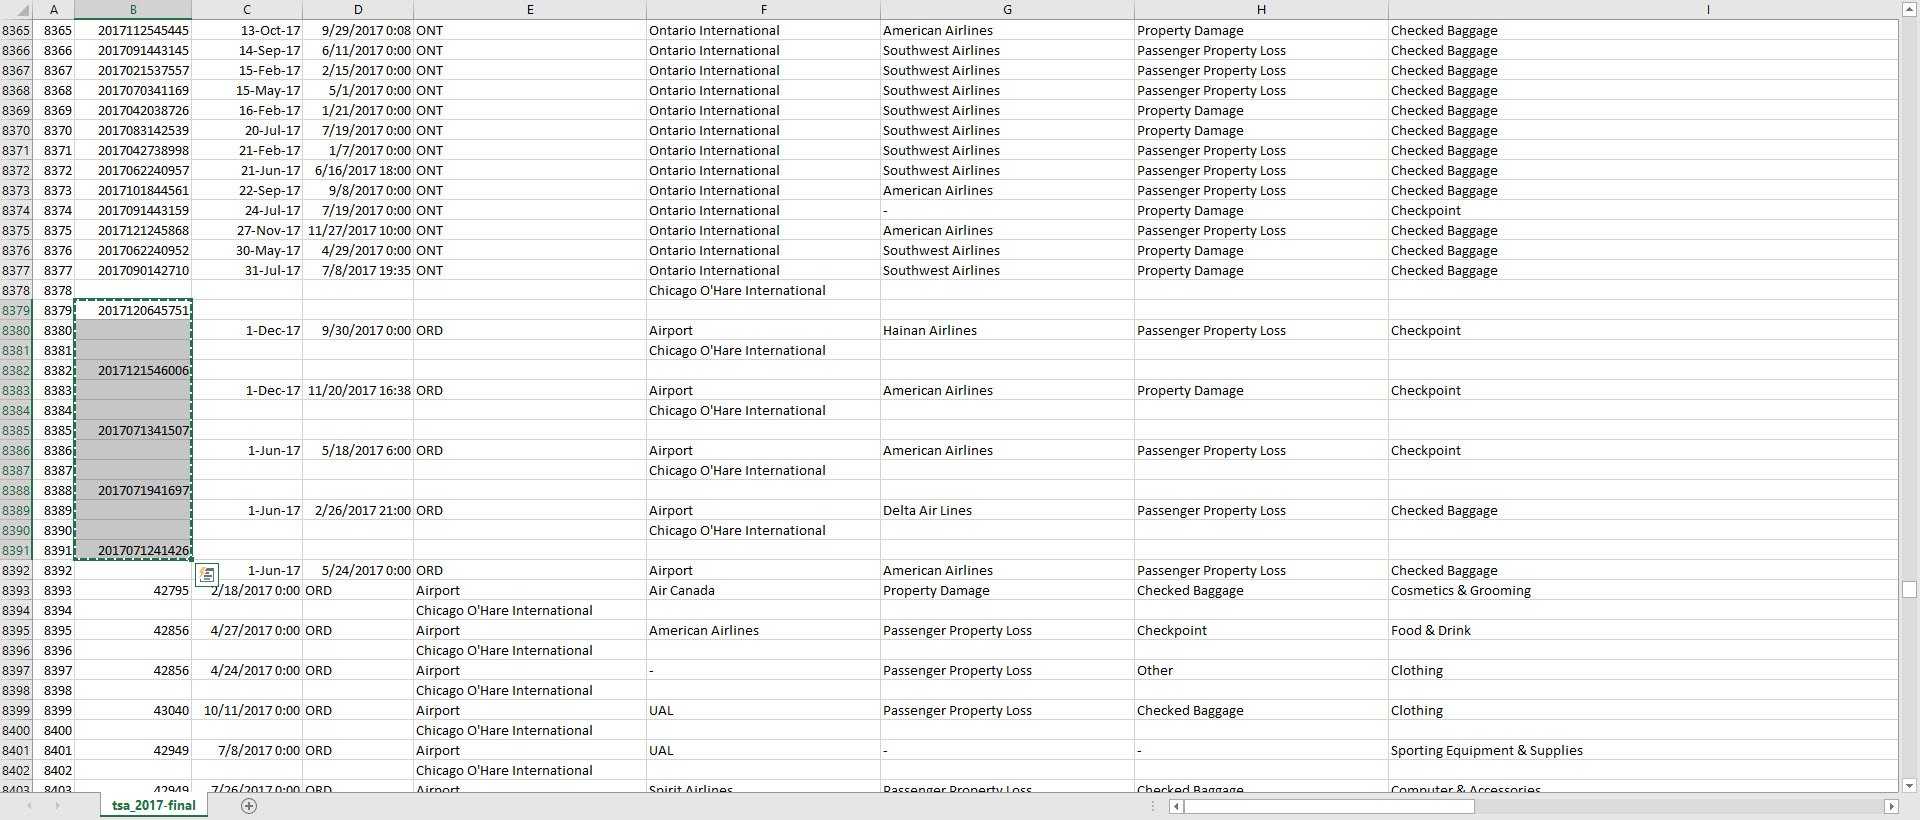
- The output of the csv file in Excel slight misaligned the columns such that I had to fix the data again. After determining the issues seemed consistent, I opted to do this semi-manually. ** Many of the airport names contained commas which pushed many of the airport names into two rows. I resolved this by created a couple new working columns and ultimately a new Airport name column using the Excel ‘IF’ and ‘OR’ functions to identify problem names. ** Luckily, name break occurred in similar circumstances where the second row name equaled “Airport” or something that would go on the end of an airport name. In the screenshot below, you can see which terms I identified. I then concatenated the rows in a new column. ** Additionally several of the claim numbers ended up on the wrong row. I moved those manually and it did not take too much time.
Data Visualization
I chose Tibco Spotfire as my data visualization tool. After importing all the files into Spotfire, I used my own curiousity and questions to walk through some visualizations. Putting everything in place proved to be challenging and in the end there may be a little bit too much in the visual. I tried to choose a color scheme that looked nice against the heat map. Blue, which I initially considered to represent the sky, felt a little too dull. I am biased towards orange and yellow and that is the direction I ended up going.
See my August 2018 submission below. All the entries can be seen on the Reddit group page.